Building React Native Apps With Salesforce Mobile SDK – TUTORIAL

Almost any business these days relies heavily on Applications, even more so on Mobile Applications. A typical business may require a wide variety of applications, Some for the Customers and some for the Employees. For example, Sales Employees might need apps that help in keeping track of their customers and doing so in the comfort of their Mobile Phones.
Companies like Salesforce realized this early and made a Mobile SDK Platform that allows developers to quickly & seamlessly build Mobile Applications with access to the majority of Salesforce Features ( such as Contacts, Sales Records, and even Custom Data ) and all of this while ensuring the Privacy & Security of the Salesforce Platform. ( If you don’t know what Salesforce is/does, to put it simply – Salesforce is a Customer Relationship Management software that is typically used by businesses to keep track of the customer response to their products & services and to keep in touch with them.
Table of Contents
What is Salesforce Mobile SDK?

It might be tempting to think “Why make a Mobile SDK platform when it’s perfectly possible to access Salesforce Data through a Web Browser?”.
Although Salesforce Data can indeed be accessed through a Mobile Browser, it is however far from being Convenient to do so, as most of the Salesforce Website is optimized for usage on a Desktop and it simply is a bad user experience on Mobile and the last thing a company aims for is providing substandard user experience to its customers & employees.
Well, then Why doesn’t Salesforce Make One Universal App and be done with it?
The truth is Most Companies would prefer having Custom Applications with their Logo, Features, and a lot more additional functionality. Doing so would simply not be possible if Salesforce made a Universal Mobile Application for accessing/Updating Data.
And that’s exactly the problem Mobile SDK solves, it allows the user to build Salesforce Apps that are fast & responsive without having to sacrifice customization
What is React Native?

React Native is a Cross Platform Framework that allows developers to build Mobile Apps for multiple platforms ( iOS, Android ) using a single codebase in React.
The best part about this is that Mobile SDK is not just limited to React Native, but can be used to build Native Android and Native iOS apps as well. This shows that Mobile SDK allows customization of not only the app but also the technology used to build the app.
This gives developers a lot more flexibility in choosing the Mobile Technology that aligns with their company the best.
If you already have previous experience with React on Web, all you need to know is that any React Framework is divided into two parts
React Web: Core React.js Library + React Rendering for Browser ( react-dom )
React Native: Core React.js Library + React Rendering for Mobile ( react-native )
This means the Core React.js stays the same, meaning stuff like Hooks, Components, State, Props, etc are the same in both React Web and React Native. The only difference is in their Rendering Library ( react-dom for browser and react-native for Mobile ), allowing for React Web developers to smoothly transition to React Native with almost no effort at all.
Using Salesforce Mobile SDK With React Native
Before moving ahead and building the application, it’s crucial to understand the functionality that Salesforce Mobile SDK adds to a React Native app
- The Salesforce Mobile SDK functionality can be accessed in React Native by using the react-native-force library provided with Mobile SDK
- This react-native-force library consists of four Modules/Bridges that handle the different areas of Mobile SDK
- Oauth – For Authentication of the Salesforce Employee or Customer
- Net – For connecting to the Salesforce NETwork and accessing the Data by sending SQL commands
- SmartStore – Used for securely storing offline data by using encryption
- MobileSync – Used to keep the Offline Data / Loaded Data – in Sync with the data stored in Salesforce Cloud
For the rest of the application, you can implement anything that a typical react native app can accomplish, allowing you to have Salesforce Functionality along with the customization of building the entire app however desired.
What will we build in the Tutorial using React Native + Salesforce Mobile SDK?
Since this is a tutorial, we’ll be building a sample application as we learn about Salesforce Mobile SDK. Doing so will solidify the concepts learned and will also allow you to apply what you just learned for better understanding.
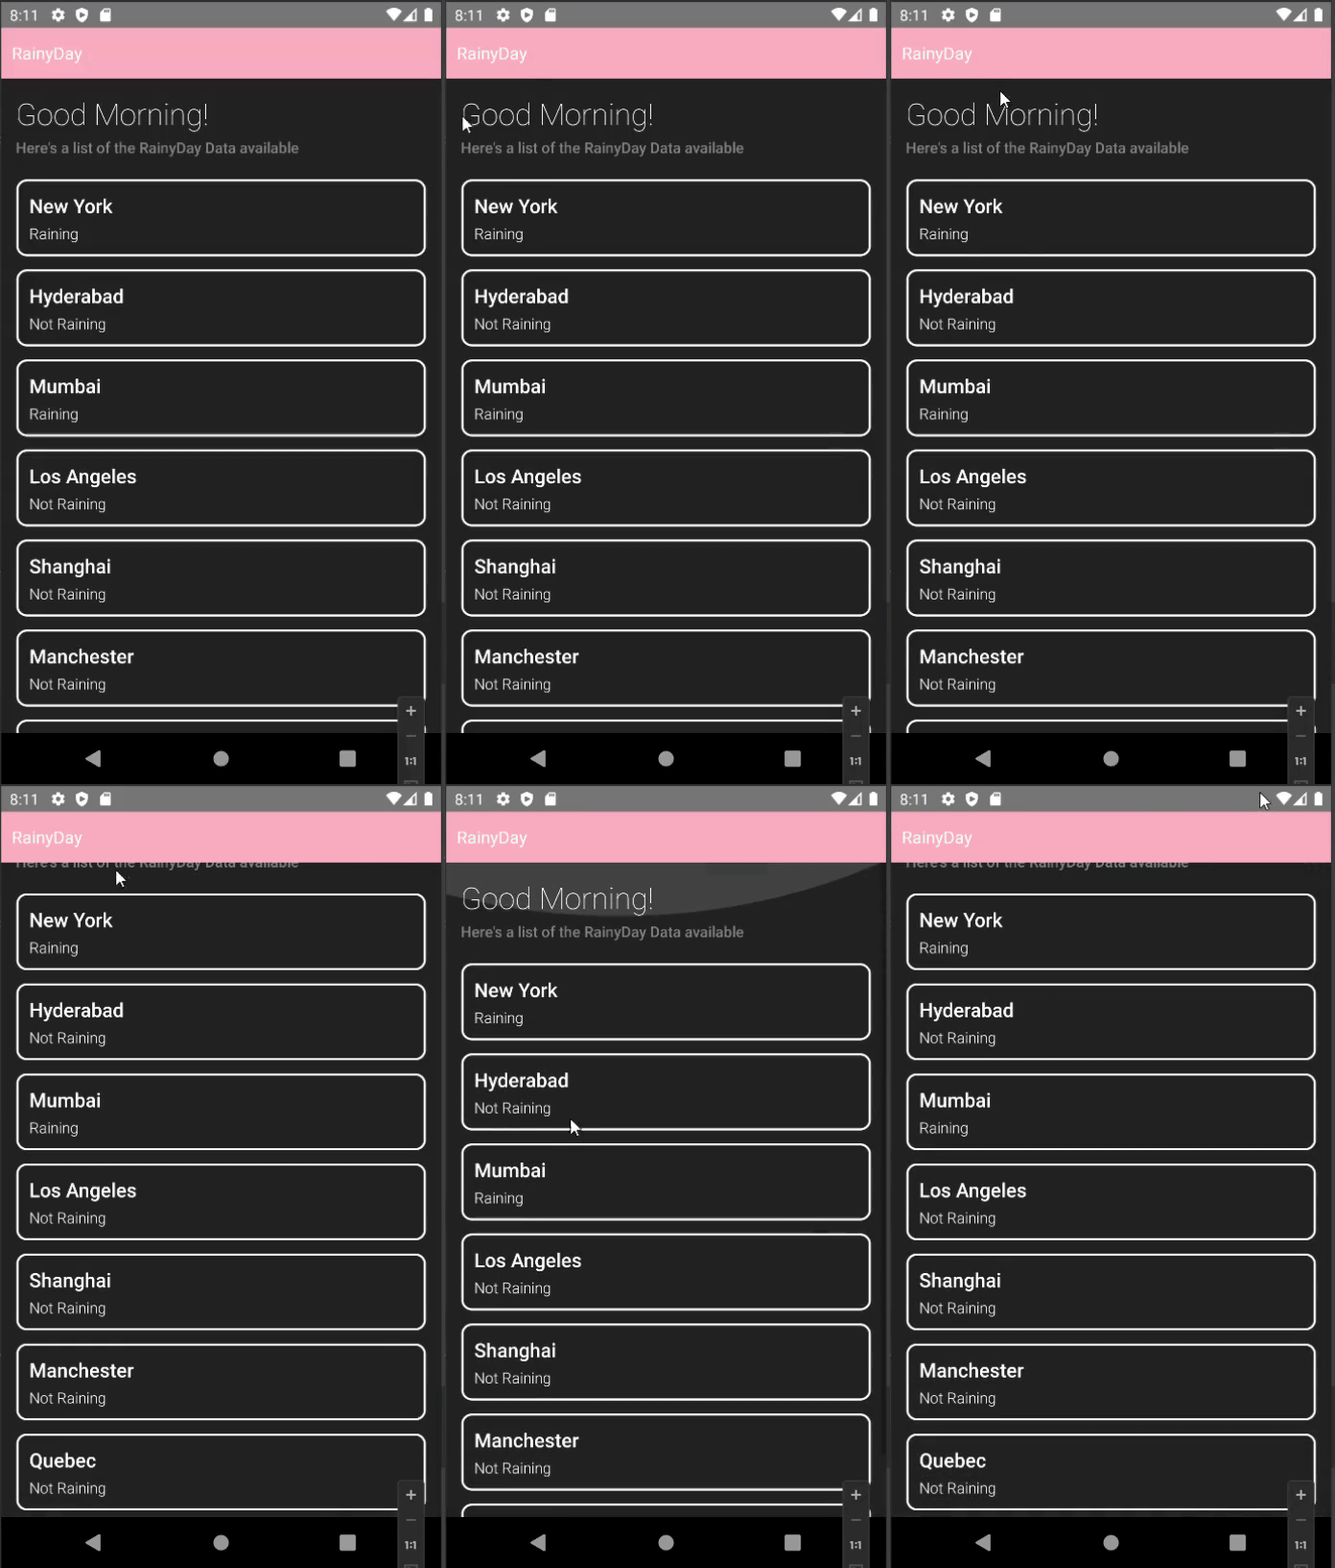
The app we’ll be building is called RainyDay, the way it works is by Loading the Stored Data from our Salesforce Database and displaying a List of Cities with the Current Status of Rain
Here’s a little demo of the final application
Part 1: Installing the Required Tools
Now that we have an understanding of Mobile SDK and how it works with React Native, let’s get started by installing the essential tools for building a React Native + Mobile SDK application
Package Manager ( NPM or Yarn )

It is completely possible to build a React Native application without using a Package manager. But almost everyone uses a Package manager such as Yarn or NPM ( Node Package Manager ) for their project as it keeps them away from the hassle of managing all of the installed packages/plugins manually.
For this tutorial, we’ll be installing NPM as it is more popular and considered to be beginner-friendly
To install NPM & Node.js
- Visit their official website https://nodejs.org
- Download the Latest Stable Version of Node.js ( 16.16.0 LTS ) as of writing this article
- Follow the on-screen instructions to install Node.js on your computer
Android Studio

To build android apps, the most used & the “standard” tool according to a lot of people is Android Studio.
Android Studio is the most complete development platform for Android Apps. It has an integrated IDE (with IntelliSense), Android SDK Manager, the ability to manage/create Virtual Devices ( or Android Emulators ), and a lot more advanced features that make android app development a piece of cake.
- To install Android Studio, visit their official website, https://developer.android.com/studio
- Click on the Download Android Studio button and wait for the installer to finish downloading
- Once the installer is downloaded, open it and choose all the default options that Android Studio provides
Android Emulator
To test the Android Application, even if you can transfer the app and install it on your phone every single time. You will sooner or later realize that it is a tedious process and takes away valuable time that could have been spent working on the actual application. Do not worry as there is a solution for it, and it’s called Emulators.
An emulator is software that is designed to run Another Operating System on our device. Android Studio by default provides us with the required tools to create and run an Android Virtual Device / Android Emulator
To Create an Android Virtual Device ( AVD ), simply go to the home of Android Studio and select Virtual Device Manager
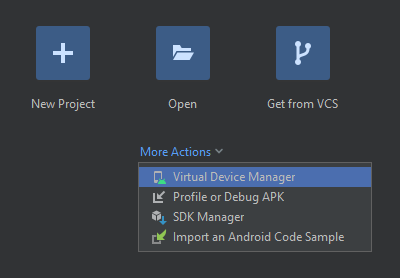
Then, click on Create Device and you should see a bunch of options as shown below
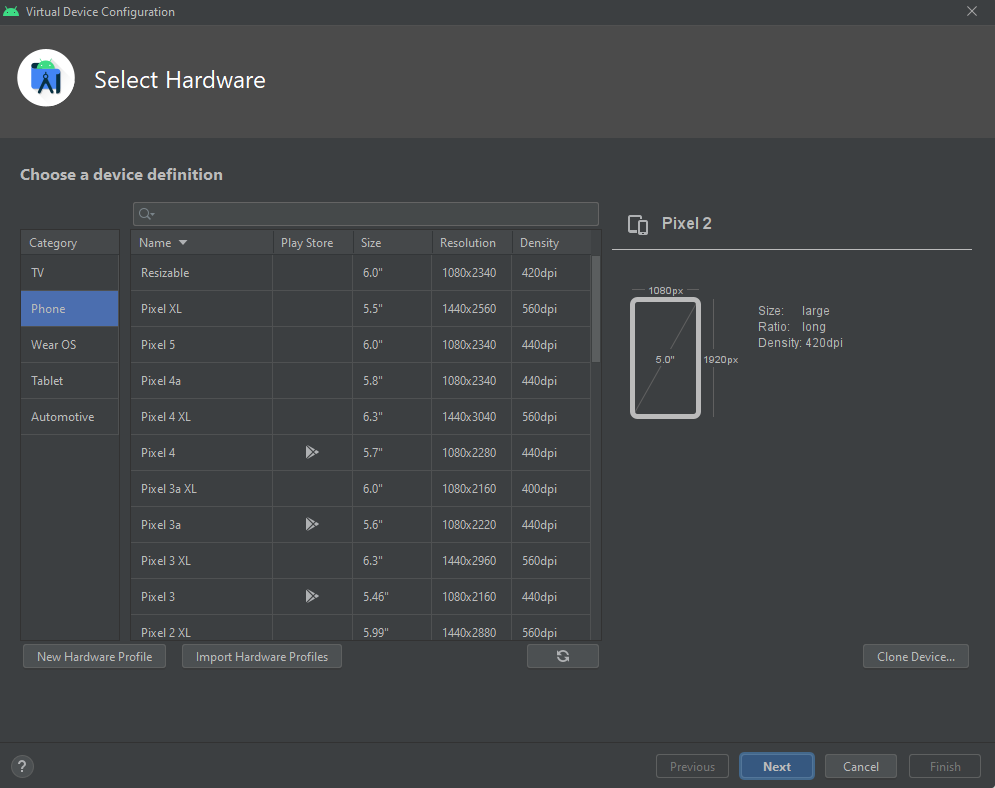
Select the type of Device ( Phone, Tablet, Android TV, Android Watch ) you want to emulate and after selecting the configuration your Virtual Device should be created. To test it simply click on Run and wait for the device to boot
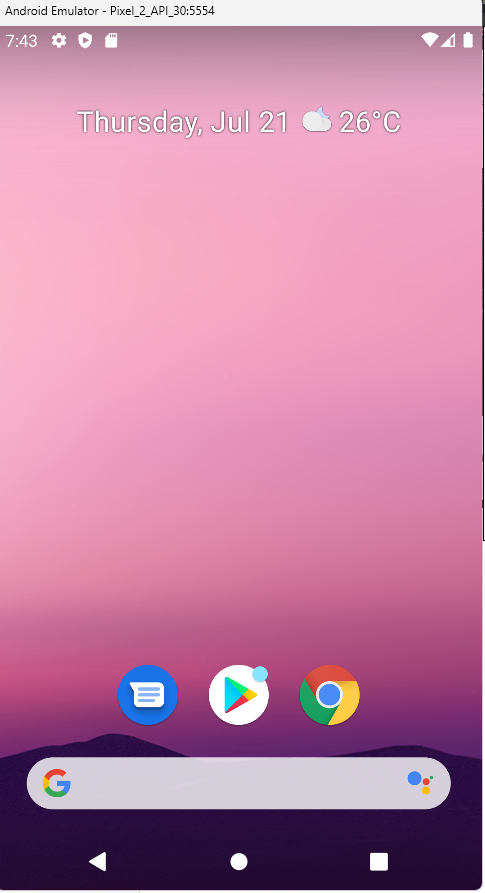
Congrats! Your android emulator is now installed and working!
Forcereact
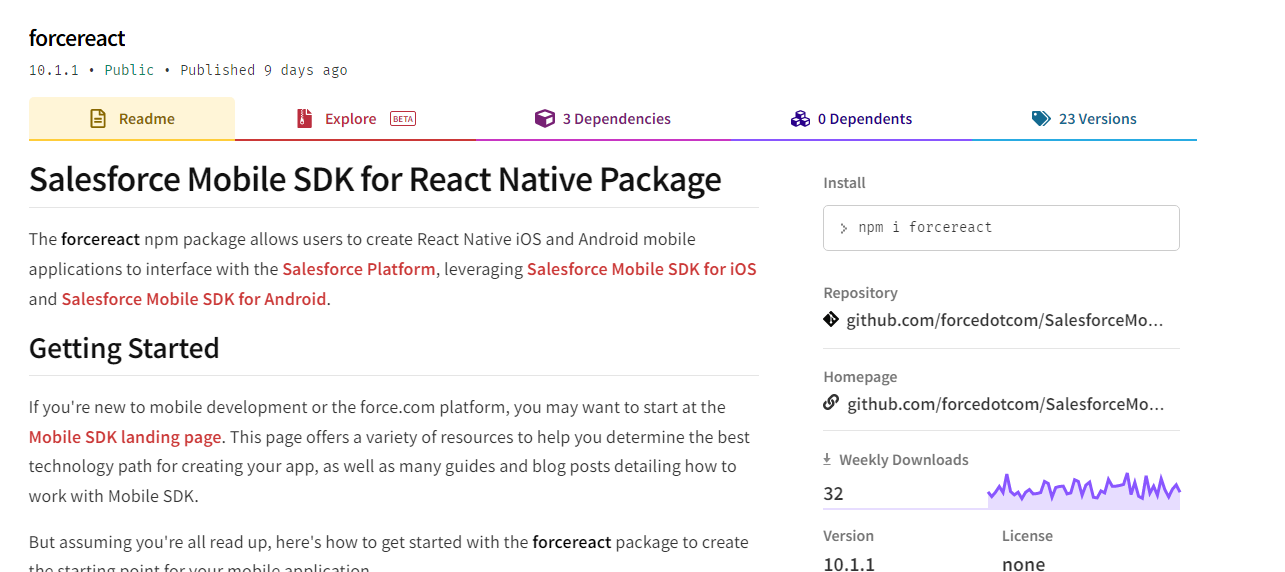
SalesForceReact or force-react is a command line tool that allows you to create React Native Applications that already have Mobile SDK integrated into them, this sizes down the entire setup process to a single force react command
Forcereact is available as an NPM package, to install force react run the following command
| npm install -g force react |
Typescript & Git

If you’ve never worked with git before, it’s essentially a Version Control Software ( VCS ) used by software developers to keep track of various versions of their product. However, we won’t be using git in this project and the only reason we have to install it is that the force reacts package depends on git to retrieve the Mobile SDK from their servers.
To install git
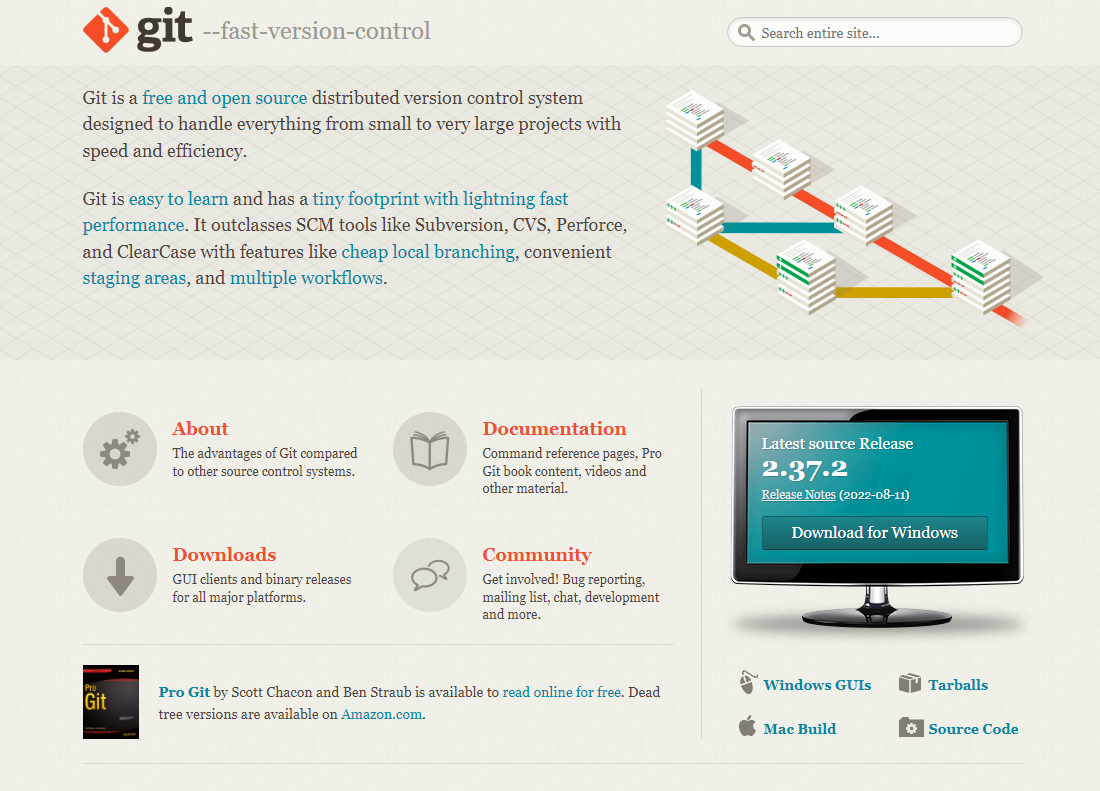
- Visit their official website: https://git-scm.com/
- Depending on your Operating System click on the Download Now button as shown below to download the latest version of git ( 2.37.2 as of writing this article )
Similarly, force reacts also has support for building React Native Apps in Typescript instead of Javascript ( If you are not familiar with Typescript, it is generally used for adding Types to Javascript to make the code more safe & predictable ). But, for simplicity, we’ll be continuing with Javascript in this tutorial
Part 2: Setting up the Project on Salesforce
After installing all the tools, it’s time to work on the App! To do so, we first have to create a Salesforce App on the Salesforce Dashboard, which we’ll then link to the React Native + Mobile SDK project
Creating a Salesforce Developer Account for Mobile SDK
Salesforce requires you to have a Salesforce Developer Account to create a Salesforce App with Mobile SDK this is because the Developer Edition of their platform offers most of the features ( including Mobile SDK ) completely free of charge ( for trial )

- Fill in the basic details ( First Name, Last Name, Email, etc ) and you should soon receive a Verification Email along with a login link
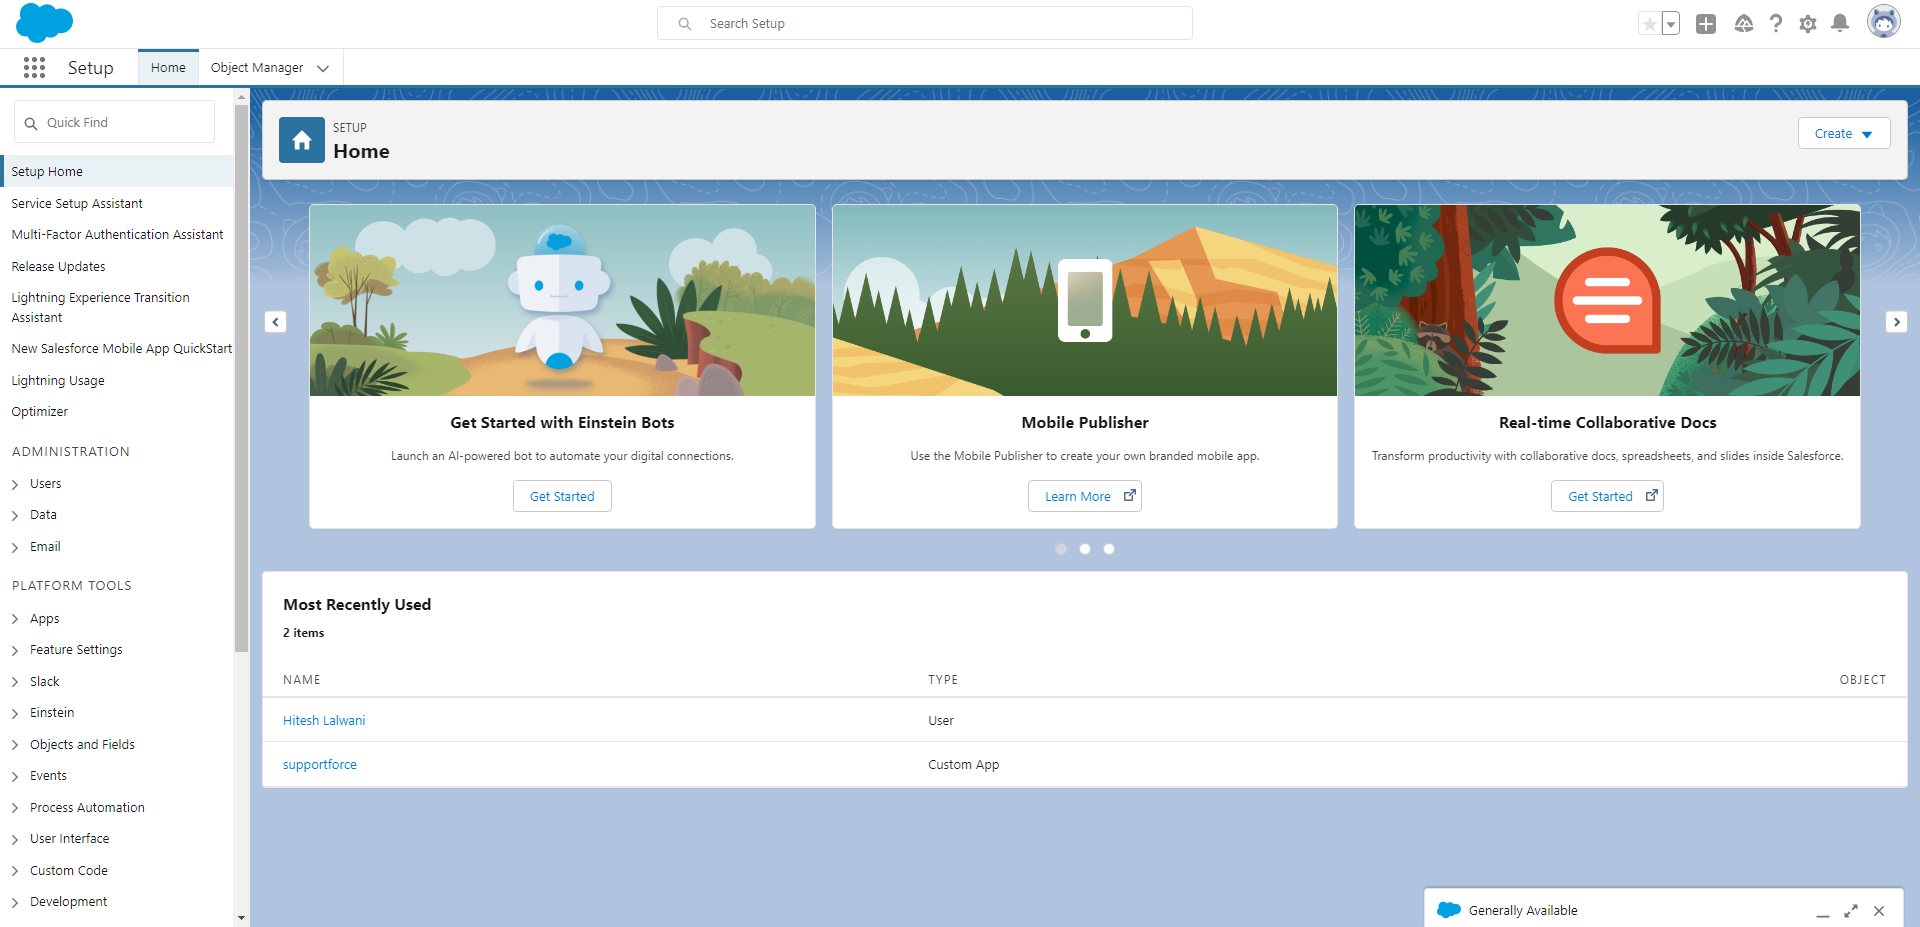
- Follow the given link, enter your Email & Password and you should be welcomed with the Salesforce Dashboard as shown below
Creating a Salesforce Lightning App
To create a Salesforce Lightning App
- Login to your Salesforce Dashboard
- Search for App Manager in Quick Find and click on the first option found
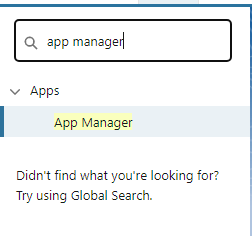
You will then be presented with a List of Pre Existing Salesforce Apps, you can very well use them if you are not interested in a Custom Application.
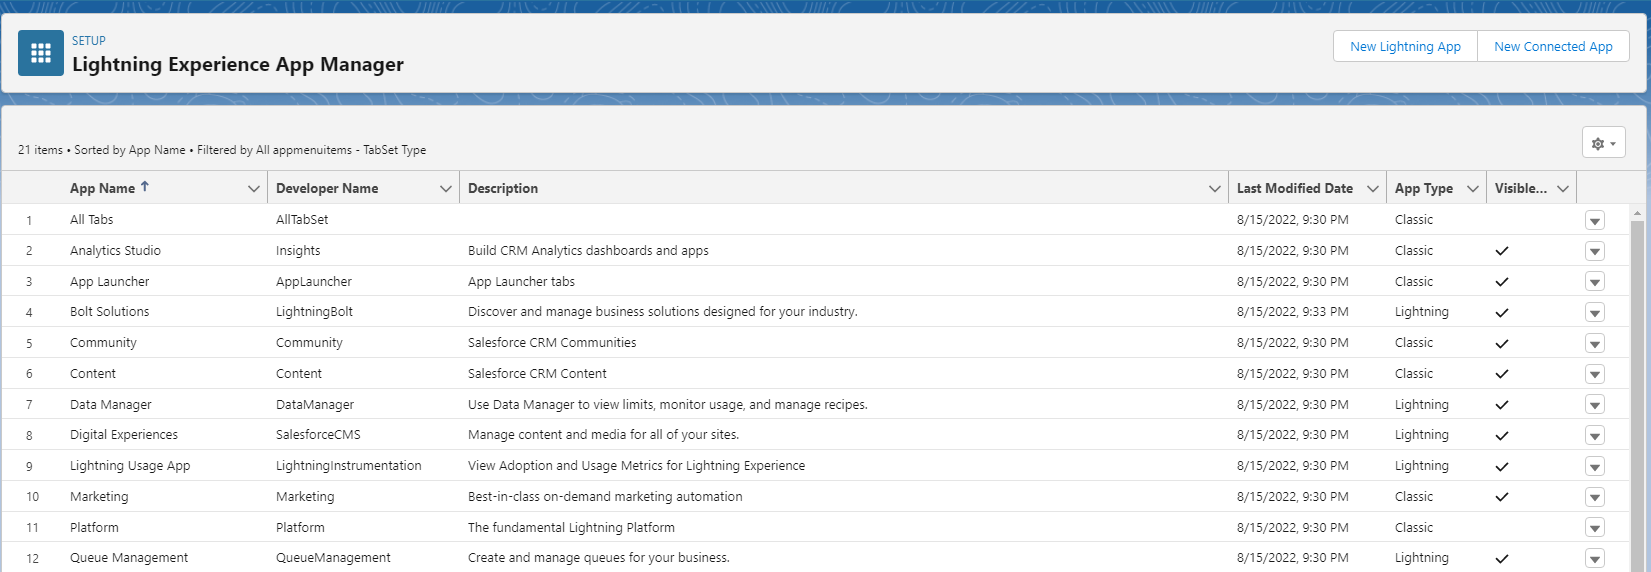
But for this tutorial, we’ll create a New Custom Salesforce App.
To do that
- Click on the New Lightning App button on the top right corner of the App Manager
- You will then be prompted to fill in the App Details such as App Name, Developer Name, App Branding, Description, etc.
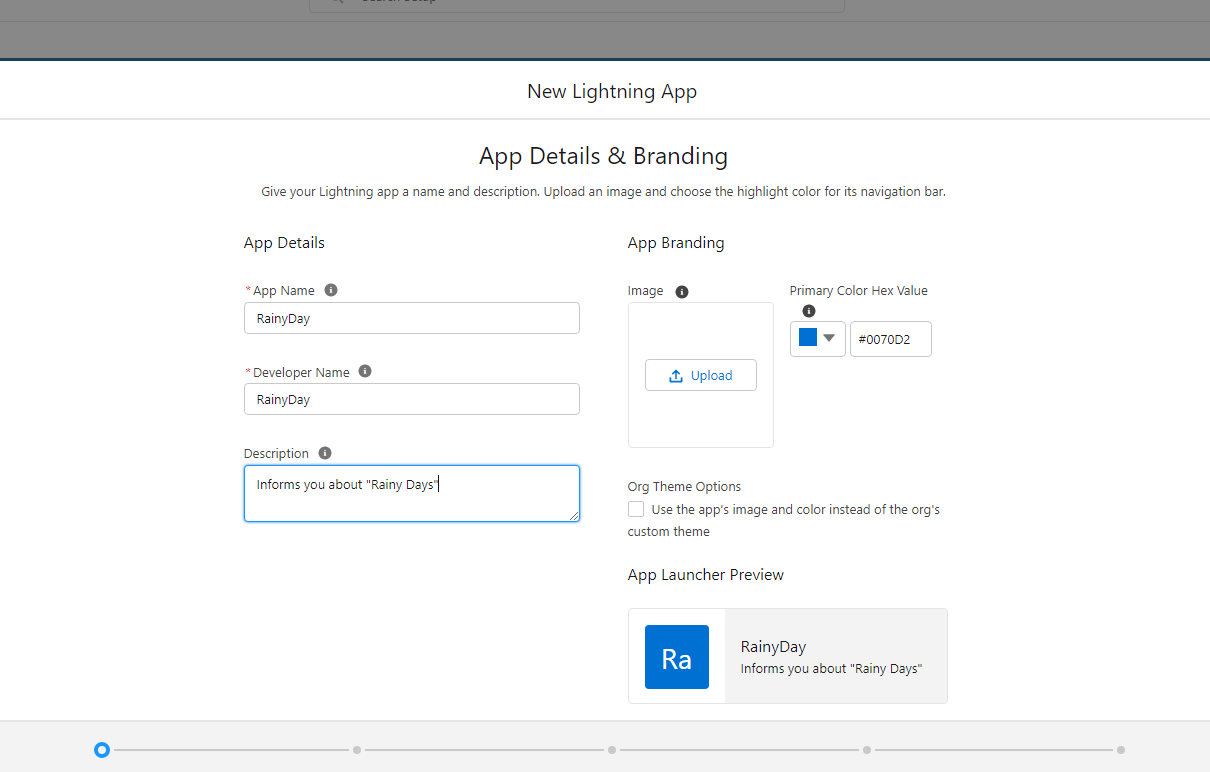
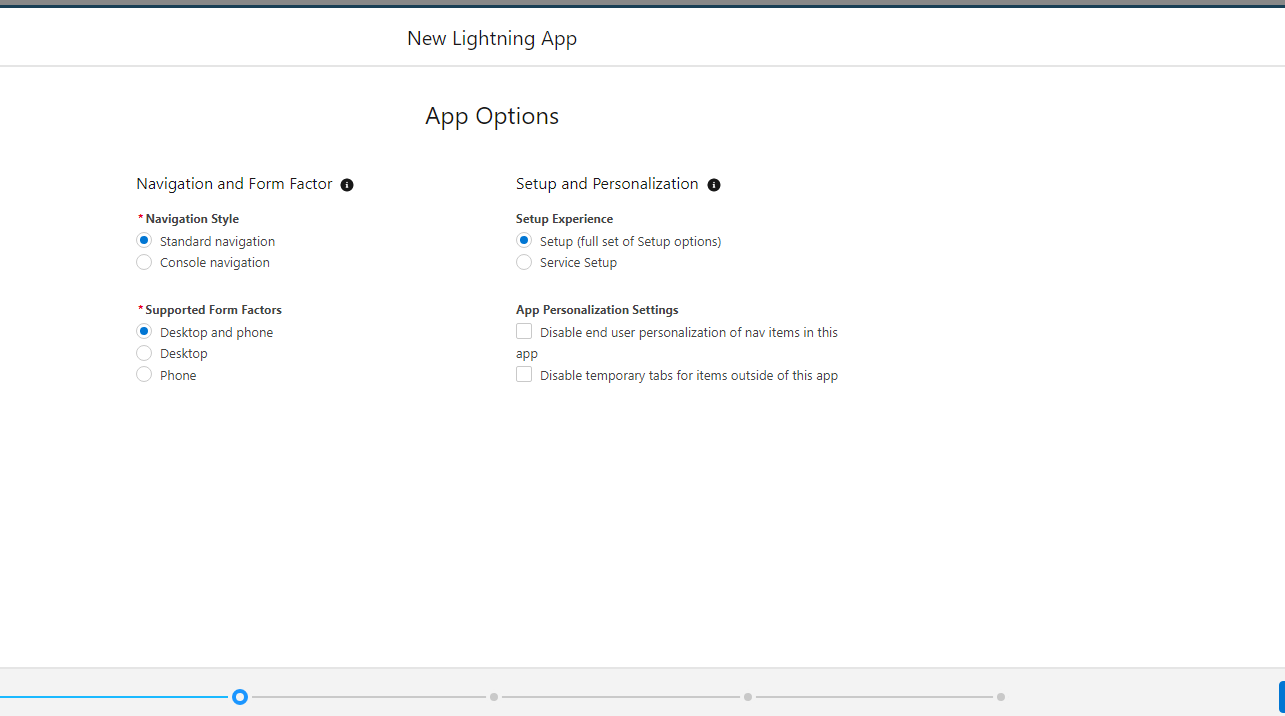
- For the rest of the options, we’ll be simply moving ahead with the defaults recommended by Salesforce
Allowing Custom Access to the Salesforce Mobile SDK App
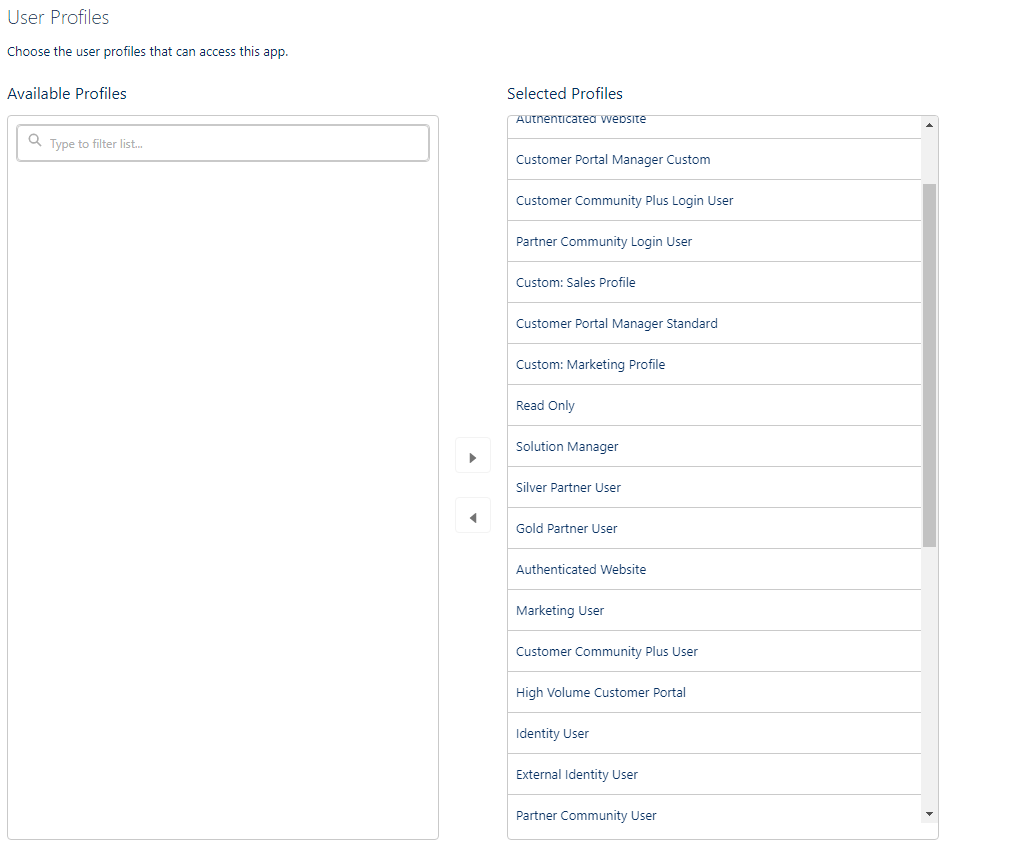
- The last step in this process is to manage who has access to the app
- This is a crucial step in the process because there might exist some apps that contain critical information that you want only the Administrator Employees to have access to.
- This setting can be managed in the User Profiles section, and since this is a simple Rainy Day application, we’ll allow all profiles to have access to the RainyDay App
Creating a Custom Object for RainyDay Data
Salesforce stores data in something called Salesforce Objects. They are like Database Tables that store essential information for the company. To create/manage Salesforce Objects we navigate to the Object Manager using Quick Find
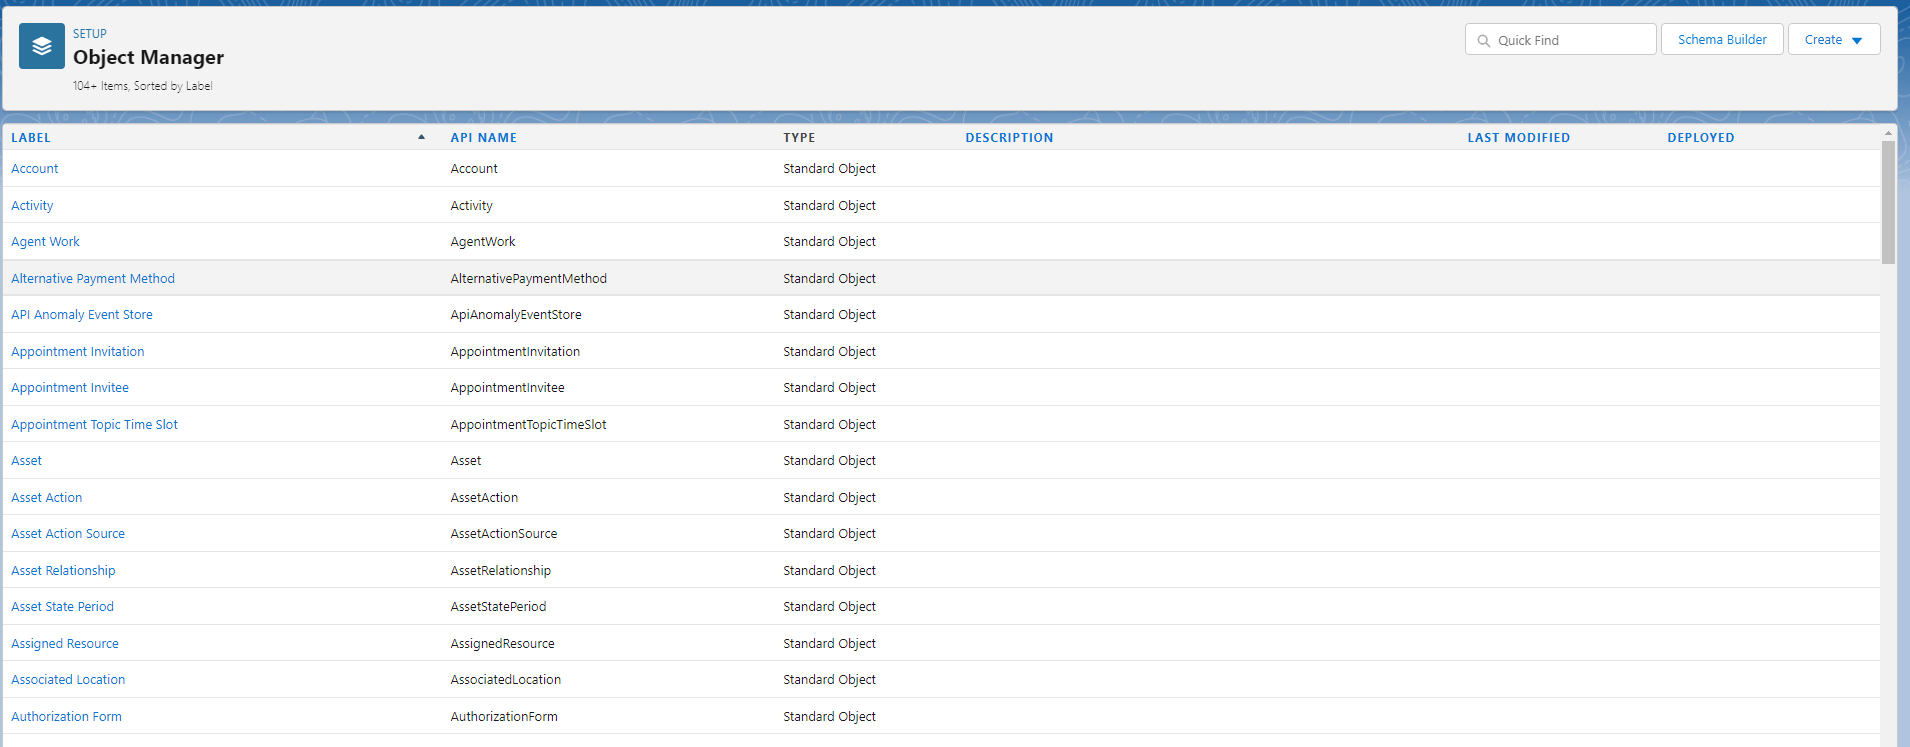
As you can see Salesforce already has a ton of Standard Objects that are ready to use, but there obviously won’t be any Object to store RainyDay data and that’s where Custom Objects come into the picture
To create a Custom Object
- Navigate to the Salesforce Object Manager and click on the Create Custom Object button at the top right corner
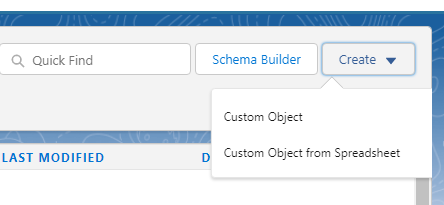
Note: If you already have pre-existing data for the Custom Object as most companies do, you can choose to create a Custom Object from Spreadsheet which will automatically import the entries for the newly created Custom Object
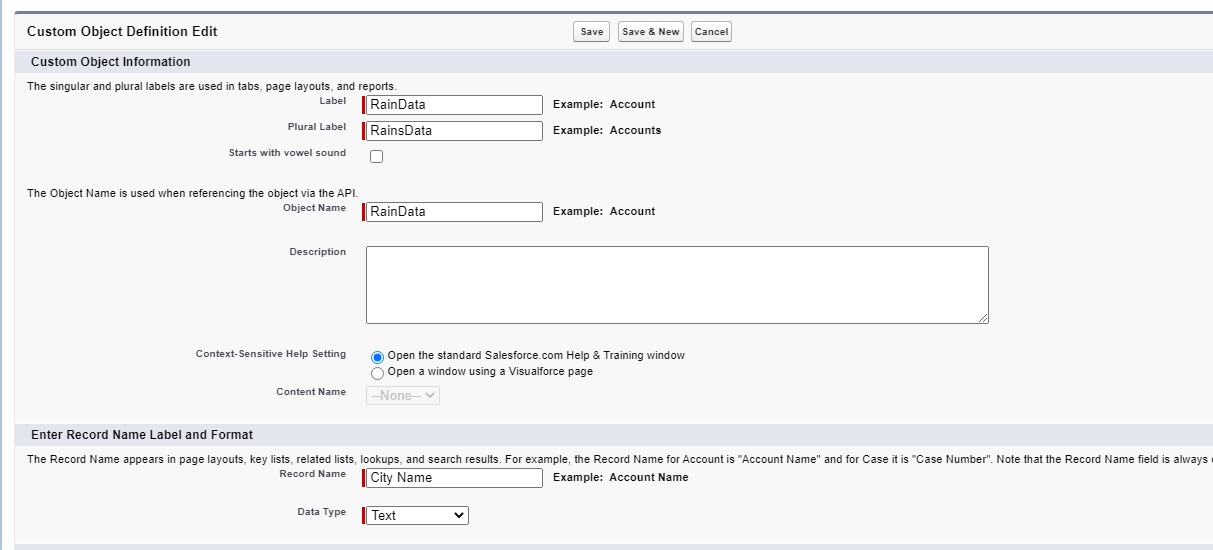
- After selecting the Create Custom Object option, you will be prompted to fill in the details for the Custom Object such as Label, Name, etc.
Understanding Fields & Records in Salesforce Objects
As we discussed Salesforce Objects can be thought of as Database Tables, with Columns and Rows
In Salesforce terminology, they are referred to as:
- Fields – The columns for a Salesforce Object
- Records – The Rows for a Salesforce Object
To store RainyDay data, the Custom Object will require two fields as shown below
| Name | train status |
| Los Angeles | Not Raining |
| Mumbai | Raining |
All Custom Objects have a Name field by default, so we only have to worry about adding the rainStatus field.
To do that,
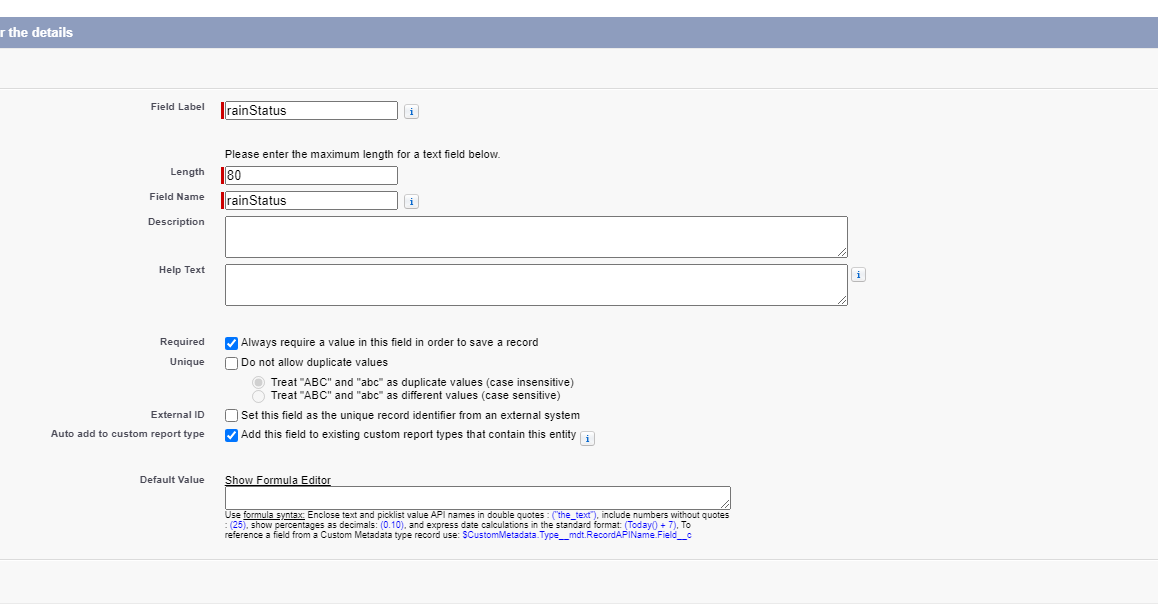
- Navigate to the Fields & Relationships section for the newly created Custom Object and click on the New Field button to create a New Field
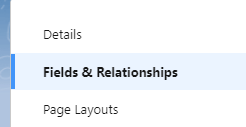
- You will then be asked for details about the Newly Created Field such as the Field Name, Type of Data the field will store ( String ) and maximum size of the data stored ( 80 characters )
After creating the Fields, it’s time to add some Sample Data or Records to the RainyDay Custom Object
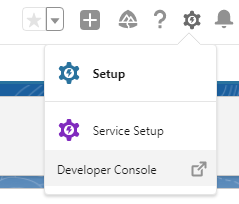
To do so, we navigate to the Salesforce Developer Console by clicking on the Top Right Gear Icon
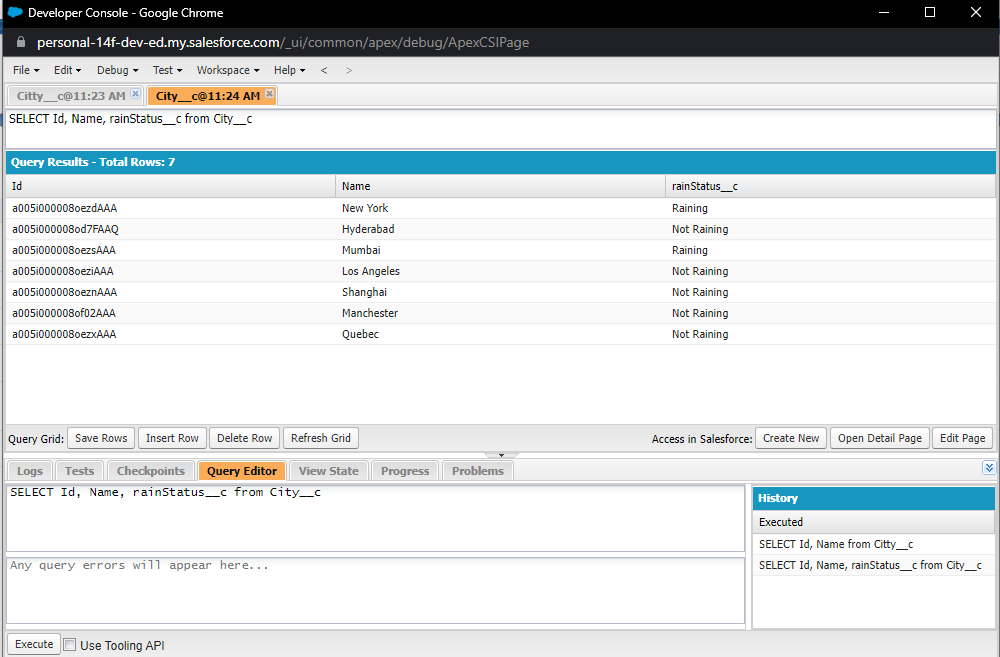
- Then, we access the Salesforce Object by running a Simple SQL query as shown below
SELECT Id, Name, rainStatus__c from RainyData__cThen, you can use the four options Insert Row, Save Rows, Delete Row, and Refresh Grid to populate the Custom Object Table with sample test data
Here’s what the Table should look like after adding test data to it:
Note: If you’re wondering why there is an additional __c appended at the end of some names, that is because they indicate Custom Fields and Custom Objects. That’s why default/standard fields such as Id and Name don’t have a trailing __c
Part 3: Setting up the React Native Project to work with Salesforce Mobile SDK
After creating the Salesforce Lightning App and adding Sample Data to it, the Salesforce part of the Setup is now complete and we are ready to move on to writing actual React Native code, to build the React Native + Mobile SDK application
To create a new React Native + Mobile SDK we use the SalesForceReact tool that we installed earlier
forcereact create


--platform=android

--appname=RainyDay

--packagename=com.curiousco.rainyday

--organization="CuriousCo"

--outputdir=RainyDayApp
The force react command takes in data such as App Platforms, App Name, Package Name, Organization Name, etc to build the app according to your needs.
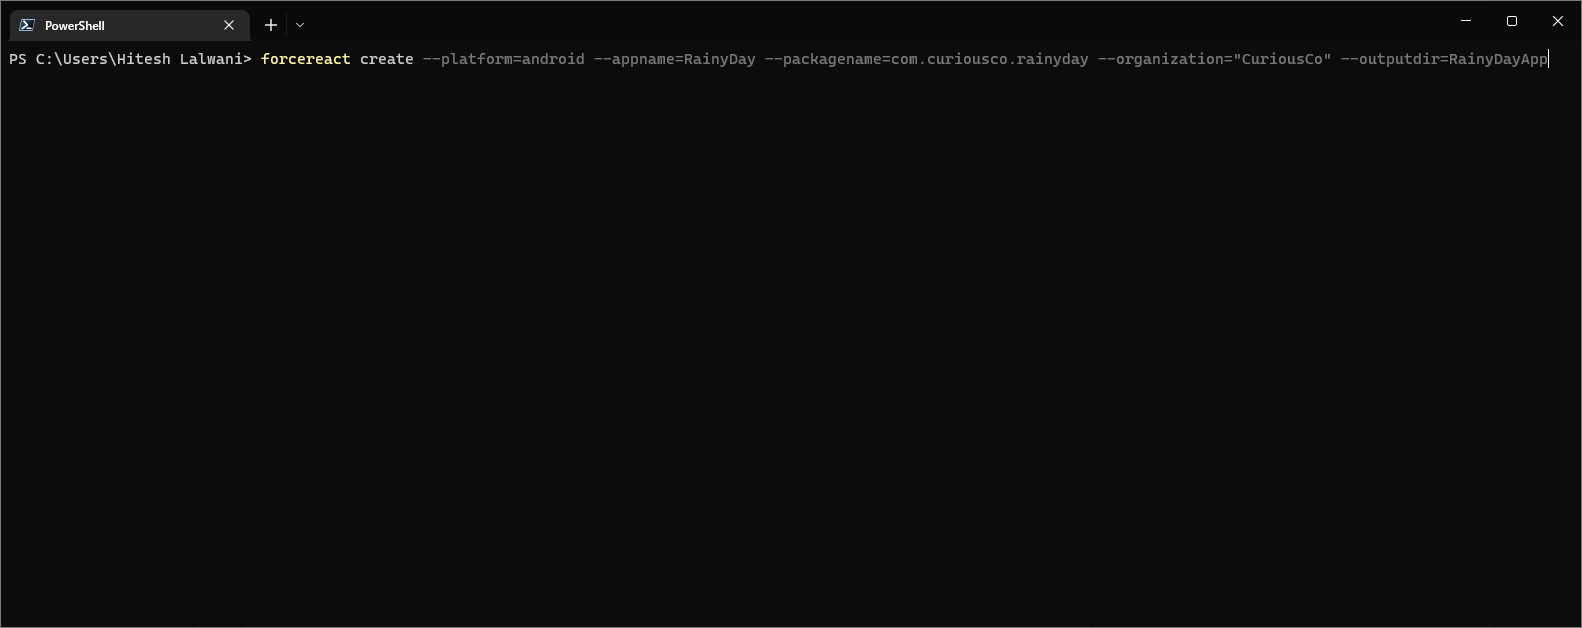
Run the above command, and if everything went alright you should see the following Success Message showing that the React Native + Mobile SDK application is created

Part 4: Building the React Native + Salesforce App
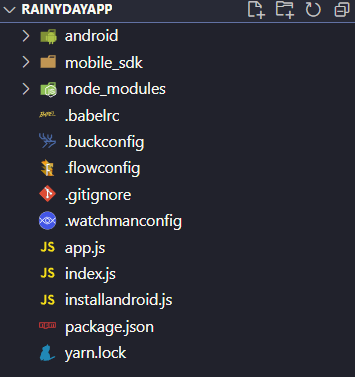
Executing the above force react command should create a new folder containing the React Native + Mobile SDK project files. Let’s take a moment to have a look at the different files & folders inside the Project Folder
Understanding the File Structure for React Native + Mobile SDK Application
- Android Folder
This contains the compiled Android Code for the React Native Application, we won’t be editing the code inside this folder but it will be used while building the APK file or running the App on an Emulator
- Mobile_sdk
This folder, like the Android Folder, is not generally meant to be edited by the developer working on the project. It contains the Mobile SDK modules ( OAuth, Net, SmartStorage, MobileSync, etc ) that we discussed earlier.
- Node_modules
This folder might be familiar to people who’ve worked before on a Node.js project, it contains all of the Node.js Modules installed using NPM for the current project
- Configuration Files
General configuration files such as .buckconfig, .flowconfig, .babelrc, .watchmanconfig etc.
These are the Configuration files for the Services used by React Native + Mobile SDK application to provide essential functionality. For eg, the .watchmanconfig is the configuration file for the Watchman service that constantly watches the active files for changes in the Code and instantly compiles the new changes without any manual intervention
- App.js and Index.js
These are the files that we’ll be writing the React Native code in, if you’ve worked with React or React Native before, you might be familiar that, every project has an Index.js file that acts as the Starting Point of the application which has a Single App Component created by default.
- Package.json & Yarn.lock
As the name suggests, these files also keep track of the Packages Installed by NPM or Yarn and generally would not be messed around with
Working on the Root App Component of Mobile SDK Application
As discussed, every React Native application by default has a Root Component usually called the App Component – and this should be enough for the particular application that we’re building as it is not very complex and can be fit inside a Single Component
After opening app.js you might already see some code present as shown below
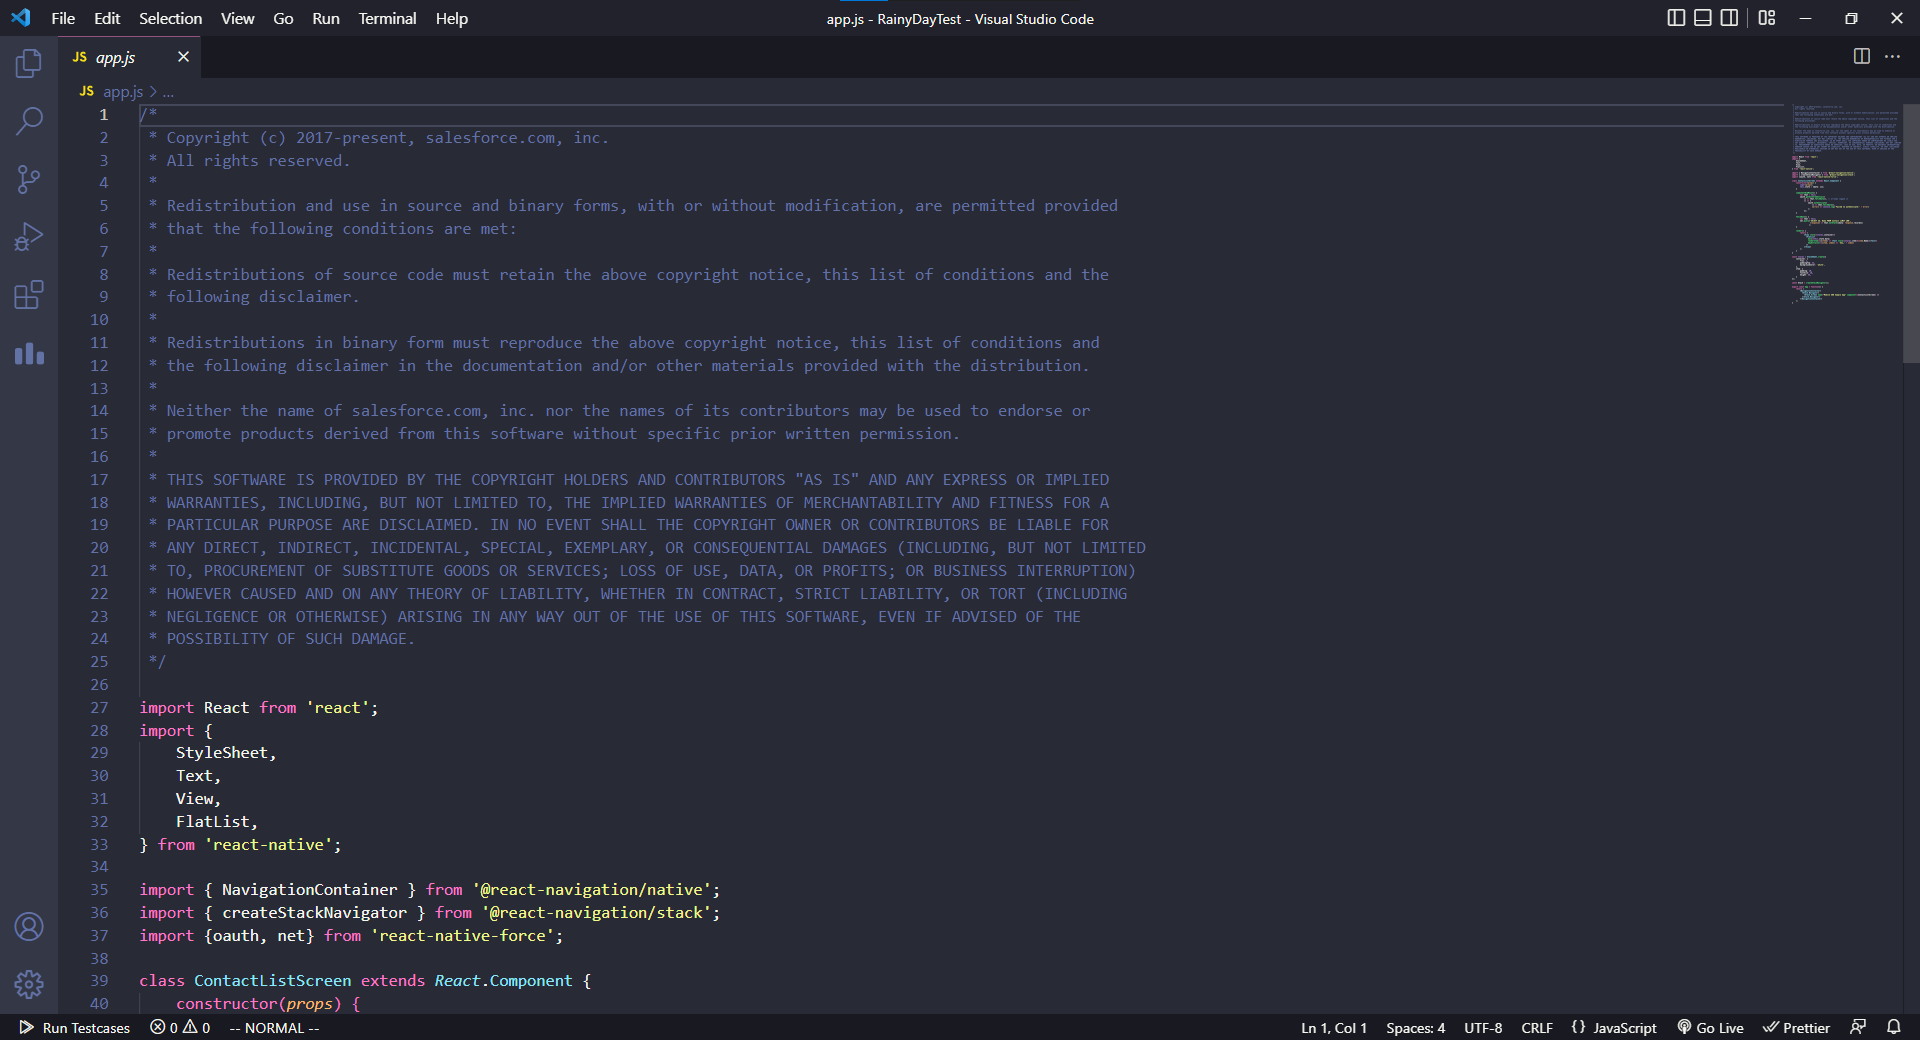
But since we are interested in learning in-depth about React Native + Mobile SDK it’s better to clear the file and start from scratch with the code below
import React, { useEffect, useState } from "react";
import { Text, View } from "react-native";

import { oauth, net } from "react-native-force";
import { ScrollView } from "react-native-gesture-handler";

export const App = function () {

return <Text> Hi World </Text>;

};
In the above code,
- We first import all of the essentials such as useEffect & useState hooks, Text & View containers, and also the OAuth & net modules from the Mobile SDK. Since we also need a Scrollable Container to display the List Of Cities we import ScrollView as well
- Instead of diving right into the app, to test everything we start by simply returning an <Text> element that displays Hi World on the screen
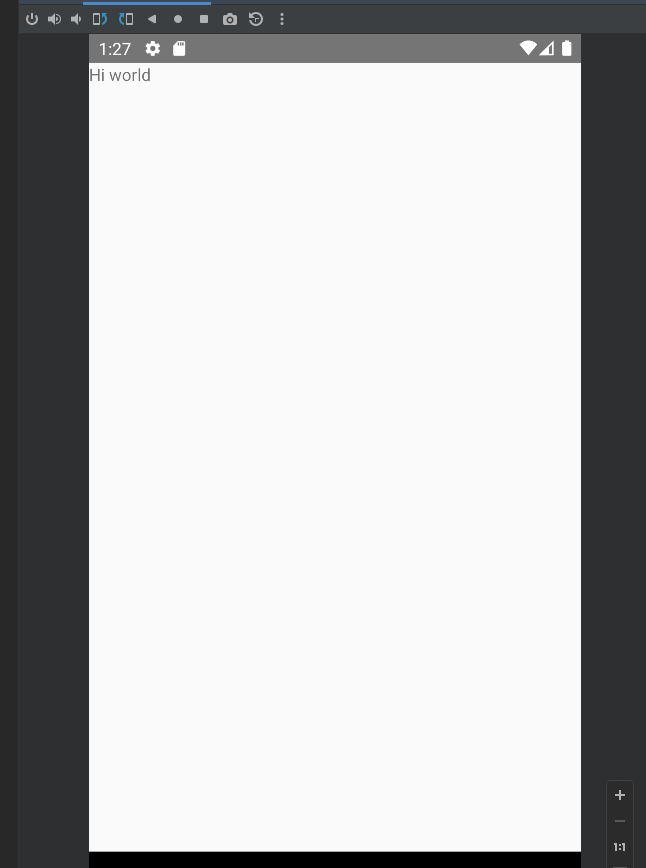
Note: You can run the project on Android Emulator by importing the android folder inside Android Studio and clicking on the Run With Virtual Device button
Now, have a look at the Final Product and try to design the App Component using Text, View, and Scroll View ( do not worry about fetching the data just yet )
Have a look at the below code only if you have tried constructing the App Component on your own.
  return (
    <View style={{ height: "100%", width: "100%" }}>
      <View
        style={{
          backgroundColor: "lightpink",
          flex: 1,
          justifyContent: "center",
        }}
      >
        <Text style={{ color: "white", fontSize: 16, margin: 10 }}>
          RainyDay
        </Text>
      </View>
      <View style={{ flex: 13 }}>
        <ScrollView
          style={{
            flex: 13,
            backgroundColor: "#222222",
          }}
        >
          <Text
            style={{
              color: "white",
              fontSize: 28,
              padding: 14,
              fontWeight: "200",
              paddingBottom: 0,
            }}
          >
            Good Morning!
          </Text>
          <Text
            style={{
              color: "grey",
              fontWeight: "600",
              padding: 14,
              paddingTop: 3,
            }}
          >
            Here's a list of the RainyDay Data available
          </Text>
          {data.map((record) => {
            return (
              <View
                style={{
                  backgroundColor: "transparent",
                  borderColor: "white",
                  borderRadius: 10,
                  borderWidth: 2,
                  key: record.Id,
                  margin: 6,
                  padding: 8,
                  marginHorizontal: 14,
                }}
              >
                <Text
                  style={{
                    color: "white",
                    margin: 2,
                    fontSize: 18,
                    fontWeight: "600",
                  }}
                >
                  {record.Name}
                </Text>
                <Text style={{ color: "white", margin: 2, fontWeight: "300" }}>
                  {record.rainStatus__c}
                </Text>
              </View>
            );
          })}
        </ScrollView>
      </View>
    </View>
  );
- The above code should be nothing too out of the ordinary, as it is simply a Component made up of Standard React Native components ( Text, View, ScrollView )
- Another thing to note would be that we are using a state variable called data that is an Array of Objects where each object contains All the Fields that we created while setting up the Custom Object on Salesforce Dashboard
Now that we have built a basic UI, it’s time to write code that Retrieves data from the Salesforce Servers and displays it on the screen
let [data, setData] = useState([]);
useEffect(() => {
oauth.getAuthCredentials(() => {
net.query("SELECT Id, Name, rainStatus__c from City__c", (response) => {
setData(response.records);
 });
});
}, []);
- As discussed, the retrieved data will be stored in a state variable called data
- To retrieve the data, we create a use effect hook ( works similar to componentDidMount if you’re familiar with Class style React Components )
- Inside this effect hook, we call the imported OAuth library to prompt the user for logging into their salesforce account
- On successful login, we use the net module to make an SQL Query similar to the one we made in Salesforce Developer Console to retrieve the data which we then update in the UI by calling the setData() method
And that’s it! What would have been a complex process of authentication and handling data was simplified into a few lines of code, thanks to the power of Mobile SDK
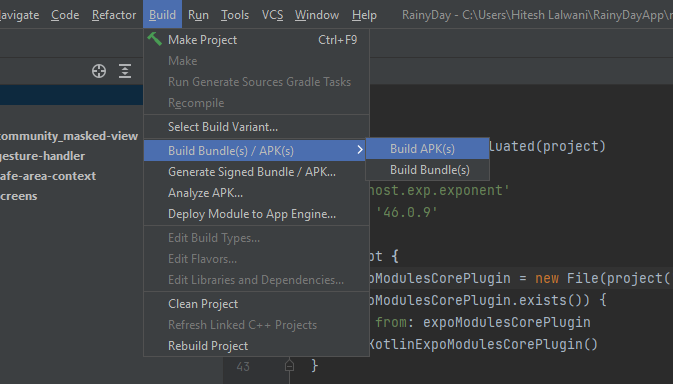
To build the APK file simply open the android folder inside Android Studio and click on Build APP/APKs option
Conclusion
Congratulations on coming this far and finishing the React Native + salesforce Mobile SDK application. Hopefully, this was a good starting point on your journey for working with Salesforce Mobile SDK. If you liked what you did today, a good next step would be to work with other modules of salesforce Mobile SDK such as SmartStorage and MobileSync and understand their benefits. You could also work on building a Native Android / iOS application using Salesforce Mobile SDK as they have wonderful support for all sorts of platforms/frameworks. If you found this article interesting and learned something new today, do share it with your friends!
